Cyclical Bull Market
“Not Quite” Super

The average “super-overbought” MBI reading occurred 54 days after a market low; June 4th marks the 51st trading day since the March 23rd low. Thus, any signal in the days ahead would arrive essentially “on time,” but the slippage (the S&P 500 gain already realized) would be enormous at around 40%!
A Stock Market Brain Teaser
The bull and bear labels can be dangerous to stock market operators, so much so that famed speculator Jesse Livermore is said to have abandoned them in favor of softer terminology: “Lines of least resistance.” We aren’t about to ditch the old labels, or even our collection of bull and bear bookends.
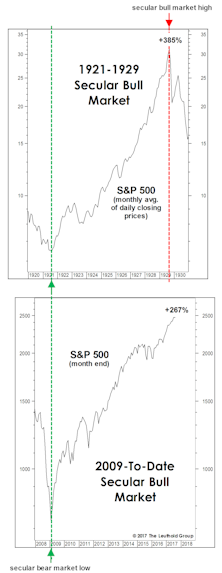
The Cyclical Bull In Perspective

This ten-year boom—one that’s taken the S&P 500 to the second-highest valuations in history—has merely lifted the index to the top end of a channel that’s contained the S&P 500’s 6% annualized gain over the last nine decades.
Four Paw Prints That Will Confirm Rumored Sightings Of The Bear

We think the odds are better than even that the September 20th S&P 500 high will stand as the stock market high for 2018, and perhaps also as the high for a historic event begun back in 2009. We’re well-prepared for that possibility, with the Leuthold Core now positioned today with net equity exposure of just 37%.
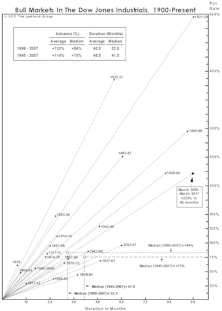
Happy 9th Birthday To An “Off-The-Charts” Bull!
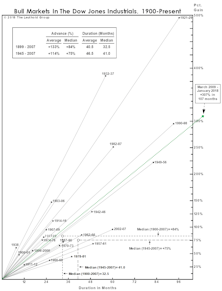
Last fall’s market rally drove the DJIA off (literally) our 1900-Present Bull Market chart. Within a year, this bull jumped two spots to #3 in the all-time rankings dating back to 1900.
The Correction That Scared No One
The setback from the January 26th market peak represents the ninth correction of 7% or more since 2009, the most ever recorded during a single cyclical bull market.
Implications Of Extreme Momentum
Historically, leadership and breadth accompanying an upside market move is far more predictive than the pure momentum of the move. But when intermediate-term momentum is not just strong but exceptional (as it was until just recently), there has usually been even more upside to follow.
Enjoying It While It Lasts
We don’t think the current stock market upleg is over.
Year Of The G.O.A.T. ?

Entering 2017, we expected a stock market “melt-up” to the 2,550-2,600 level on the S&P 500—a move we thought might run into trouble by late summer.
Could It Be A “Two-Fer?”
The milestones achieved by the current cyclical bull market have been so numerous that we hope you’ll forgive us for missing one back in May.
A “Measured” Melt-Up
The stock market “melt up” scenario is underway but has proven less broad than we expected. Just as in the late-1990s, Technology and NASDAQ are the main subjects of investor adulation.
A Subdued 8th Birthday Celebration
The hoopla falls short of that which surrounded birthdays #3-#7; based on the flood of assets into passive stock funds, it appears complacency has set in. Current bull close to becoming longest in history.
Acting Like A “New” Bull Market?

With DJIA and S&P 500 losses in the 2015-16 decline limited to less than –15%, there’s no way we’d argue the episode represented a completed cyclical bear market (and we said so at the time).
Too Many New Highs To Make A High?
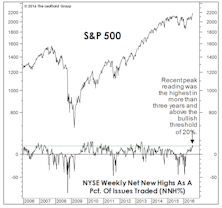
The number of NYSE 52-Week Highs typically peaks during the bull market’s strongest leg, before contracting into the final top. Last month, Net New Highs made a three-year high—implying more upside.
Ready For Year Eight?

Assuming—only for the sake of argument—the bull remains intact, its seventh anniversary will mark a rare case in which the market was lower than at its anniversary a year earlier.
Disciplines Remain Bullish, But...

Current conditions remain cyclically bullish for equities, however, the mathematics don’t support the “secular” bull market thesis, or those betting that stocks can be propped up by the economic expansion.
Major Trend Moves To Neutral, But Not All Hope For The Bulls Is Lost

Deteriorating Technicals drove the move to Neutral, but a new positive reading in the Attitudinal category gives some hope to the bulls.
Rising Stocks And Rising Rates: It’s Not Uncommon

Today may feel different, but it isn’t. The past 13 months’ trading action in the U.S. is the second example of this phenomenon in the current (2009-to-date) cyclical bull market. We focus on 11 previous episodes for perspective. Plus we clarify recent thoughts on interest rates and stock market valuations.
The Rolling Stock Market Top Of 2013 (… And 2011, 2010, And 2009)
We’ve frequently mentioned the two-faced nature of thematic leadership during the current bull market. Filtering out the minor swings, Phase One lasted from March 2009 through February 2011 and was dominated by low quality, high beta and cyclical stocks.
Stocks And The Economy

We’ve written before about retail investors’ tendency to “conflate” stock market action with movements in the underlying economy. Misunderstanding this interrelationship generally causes the public to liquidate stocks when the economy is weak, only to ultimately buy them back when the economic recovery is obvious to all.
Perception for the Professional
March 2026 Issue

Featured Articles
Sector Navigator
March 2026 Issue
