Crude Oil
The 2022 “Tax Hike” Repealed!
In the last twelve months, spending on energy goods and services as a share of total consumer outlays dropped by 1.1%—that amounts to about $200 billion in savings (annualized).
Energy: Kicking A Dog When It’s Down
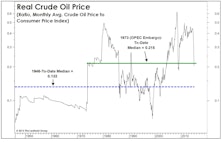
With crude trading at only about half the level seen in the first few years of this expansion, there might be a tendency to view its current price as depressed. But from an inflation-adjusted perspective, today’s price sits right on top of its modern-era (post-embargo) median.
Bust To Boom, And Back Again
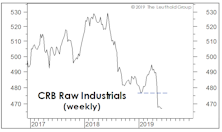
Last month, we observed that crude oil was the only item propping up broad-based commodity indexes, and that something was bound to give with the U.S. dollar pushing to new highs.
Oil And The Dollar At New Highs: Is Something About To Give?
.jpg?fit=fillmax&w=222&bg=FFFFFF)
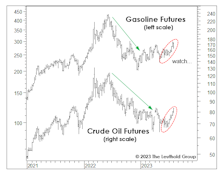
Crude oil and the U.S. Dollar Index accomplished a relatively rare feat by moving to simultaneous six-month highs earlier this week (Chart 1).
A Crude Catalyst?

The great mystery behind the trade-weighted dollar’s nearly-10% YTD decline is that it’s failed to fuel further gains (or any gains) in commodity prices in 2017.
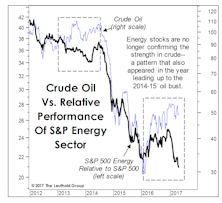
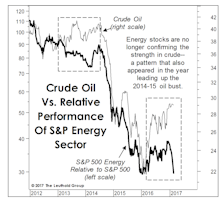
Energy: Too Early To Bottom Fish
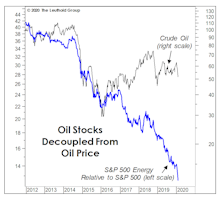
The gap between crude oil prices and Energy sector RS is now much wider than seen even at that historic 2014 juncture. The “divergent” weakness in Energy stocks suggests that crude will likely trade lower.
Another Leg Down In Crude?
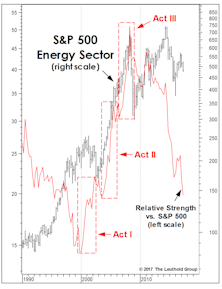
Remember the special amplifiers used by the fictional rock group Spinal Tap that could be dialed up to eleven? S&P’s decision last year to designate Real Estate as a full-fledged sector means that our GS rankings can now be dialed down to eleven, and unfortunately the Energy sector has been a frequent occupant of that undesirable spot.
What’s Wrong With Energy Stocks?
One of our disappointments with the Group Selection (GS) Scores in 2016 was their failure to latch on to the rebound in Energy groups.
The Bullish Case: A Mental Exercise

We’ve been correctly positioned near our tactical portfolios’ equity minimums, yet we’re oddly compelled to use this month’s “Of Special Interest” section as a very public second-guessing of that move.
VLT Flashes A BUY On Oil
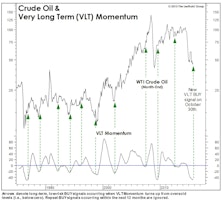
As expected, our VLT Momentum algorithm triggered a “low-risk” cyclical buy signal on crude oil in late October, only the 11th buy signal in the past 30 years. This algorithm was originally designed to identify low-risk entry points into the stock market, but we’ve found it useful with other assets as well.
A Lasting Low In Crude?

In our naïve way of measuring market moves, WTI crude oil is about 15% from its $53.27 December 31st closing price. But thanks to financial television, we’re beginning to wise up.
Oil Price “Crashes” In Historical Perspective
In view of the last year’s steep decline in oil prices, Energy has been a frequent headline topic.
Inflation—Expecting More Drag From Oil
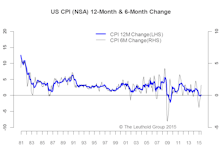
With the recent weakness in oil prices and the renewed strength of the U.S. dollar, we would not be surprised to see weaker headline numbers in the next few months. The expectations of a rate hike might actually end up pushing the rate hike further out. We are now less sanguine about a pick-up in PPI in the rest of the year.
Oil Prices And VLT

Energy groups continue to rate poorly in our quantitative work, but change will probably be afoot in the second half.
What’s Next For The Dollar?
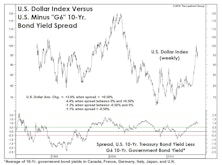
The U.S. Dollar Index has recovered about half the losses from a two-month, -7% setback from the 12-year peak it established in March.
A Few Thoughts (And A Lot Of Charts) On The Oil Collapse
Has the recent collapse in crude oil prices presented us with a good opportunity for an outright commodity investment? No. Energy stocks aren’t on our radar screen either.
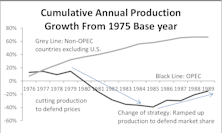
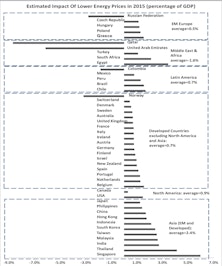
A Look At The Impact Of Lower Energy Prices On Countries
A big question for investors is: have oil prices bottomed? For the past four days, WTI jumped 19% from its low reached on January 28th, giving some the conviction that prices are reverting back to prior high levels.
Declining Crude Prices Good For Emerging Markets?

The price of crude oil staged a dramatic change of fate in the past few months, and the bottom is still nowhere in sight.
Outlook For Energy

A look at the GS Scores for the broad Energy sector in light of the recent decline in crude oil prices. Today, only one of the Energy related groups is rated Attractive, while 3 are Neutral and 3 Unattractive.
Examining Oil Prices Vs. The S&P 500

A chronological chart of the relationship between oil and stock prices.
Perception for the Professional
March 2026 Issue

Featured Articles
Sector Navigator
March 2026 Issue
