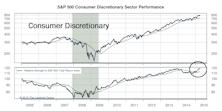
Consumer Discretionary
Consumer Discretionary Holds At #1
This year we’ve written several notes surrounding the Consumer Discretionary sector’s prominence among our top Group Selection (GS) Scores. This pattern persisted for a fifth consecutive month in April.
Keep An Eye On “Relative” Inflation
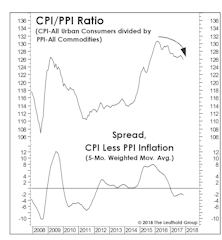
While our Group Selection (GS) framework hasn’t yet warmed up to commodity-oriented industries, our macro work suggests perhaps it should.
Consumer Discretionary Back On Top
Of the 110 industries in our framework, the top seven are all Consumer Discretionary.
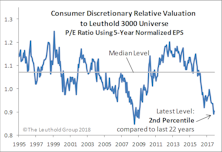
A Contrarian “Late-Cycle” Play?

The Amazon Effect masks both the underperformance of the average Discretionary stock and the relative value that’s been reestablished across the sector. “Discretionary ex-Amazon” is a better contrarian pick than Energy.
Retail Fades; Other Consumer Themes Flourish

Shifting consumer preferences and the relentless rise of e-commerce are changing the sector’s beneficiaries of the healthy backdrop away from retail, yet other Discretionary opportunities abound outside of the traditional retail groups.
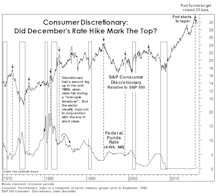
Discretionary: Is The Top Finally In?
Sector swings have been wild enough thus far in 2016 that Consumer Discretionary’s relative weakness has drawn little commentary.
GS Score Sector Rankings, and Highlighted Attractive Groups
Health Care, Consumer Discretionary, and Financials are the top three rated broad sectors.
Health Care & Consumer Sector Strength Explored
While we view the industry group selection as the most important decision, looking at the sector level rankings also helps us identify broad trends. Here we highlight the top two rated sectors, currently, which also represent a combined >40% weight in our Select Industries Portfolio.
Can Consumer Discretionary Relative Strength Continue?
Despite this sector’s extended outperformance, we think this trend may persist in the near term as Discretionary industry groups look increasingly attractive within our group work. Keeping an eye on the Fed Funds rate is key, however.
New Highs = Neutral
We remain positioned with below-average net equity exposure in tactical portfolios for now. We’re inclined to think there may be more trouble ahead for the stock market.
Automotive Retail Shines In A Dimming Sector
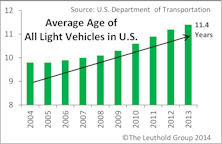
We examine the highly ranked Automotive Retail group and explain why, despite its recent strength, it may still have room to run.
Late March Reversal… And The First Shall Be Last
We examine the impact of March’s strong group leadership reversal on the top and bottom of our group model.
Profit Margins At The Sector Level
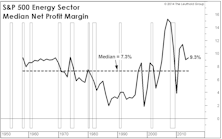
All ten of the S&P 500 sectors recorded a sequential increase in four-quarter trailing net profit margins. But consider where sector margins stand today relative to their 25-year medians. Eight of ten S&P 500 sectors are recording profit margins well above their long-term medians.
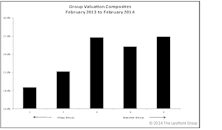
Consumer Discretionary: End Of The Run?

Last month we suggested the top sector for 2013 would fall from grace in 2014, and the Consumer Discretionary stocks have been quick to cooperate in the last five weeks.
2013 Factor Performance: What Worked? What Will Keep Working?

Momentum and Value worked in 2013. Materials and Financials were the easiest sectors to exploit; Discretionary and Tech the most difficult. Momentum works in December; Value and Small Caps at the start of the year.
Group Models: Info Tech Tops Domestic, Financials Remain Atop Global
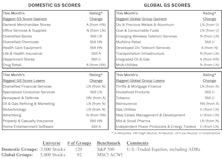
Both models have numerous Information Technology and Financials groups in Attractive territory. Neither model has any Unattractive Tech groups. Alternatively, neither model has any Attractive Utilities groups, while several Utilities rate Unattractive in each.
Group Models: Info Tech Tops Domestic, Financials Tops Global
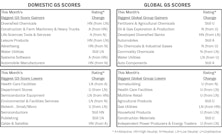
Both models (particularly domestic) have a number of Attractive rated Information Technology groups and no Unattractive rated Tech groups. Financials’ domination of the Global Attractive range continues.
A Comprehensive Look At The Emerging Markets: Diagnosis And Prognosis
We examine Emerging Markets from both the top-down and bottom-up perspectives as we try to identify where to move and what to expect. We check in on two successful EM thematic group ideas as well.
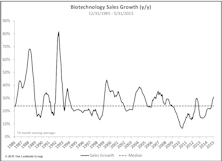
Key Observations On Q2 S&P 1500 Earnings
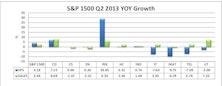
Year-over-year EPS growth rate for companies with Q2 reports (with about 65% in) currently stands at +4.2%, while revenue growth has come in at a better than expected +2.6%.
The Short Side—Still Ahead YTD
Our AdvantHedge Composite lost 5.9% in July, lagging the inverse performance of the S&P 500 (5.1%), but outpacing both the NASDAQ (6.6%) and the Russell 2000 (7.0%) as the market returned to “risk-on” mode.
Perception for the Professional
March 2026 Issue

Featured Articles
Sector Navigator
March 2026 Issue
