A/D Line
Not Dot-Com
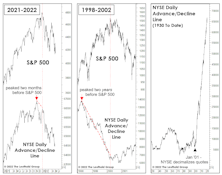
Bulls have been quick to assure us that this market “bears” no resemblance to the dot-com bust. We agree—but probably for very different reasons. Among them are the conventional breadth measures, which provided little warning of this year’s January peak. And, the initial decline off January’s top has been much broader than during the first phase of the dot-com bust.
Testing The Transports
A new market high that is not confirmed by the stocks of companies that “move the goods” is a warning signal. We reviewed the Transports’ action in all years the S&P 500 accomplished a 12-month high during the month of July, like it did this year.
Weakening Foundation
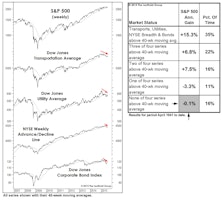
Over the last few months, we’ve presented a couple of simple quantitative studies meant to encapsulate the factors driving our Major Trend Index to the brink of bear territory. The chart and table might provide the best summary yet.
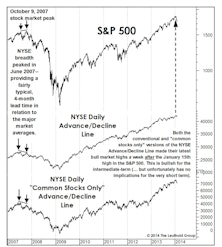
Two Takes On Market Breadth

Market technicians continue to argue that a bull market peak is unlikely to form with the majority of U.S. stocks (and global ones, for that matter) still participating in the new highs of the blue chip indexes.

What The Market Tells Us About Fed Policy
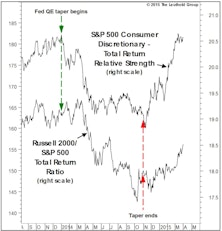
Poor performance in 2014 by two typical victims of Fed tightening—Consumer Discretionary and Small Caps—corroborated our argument that “tapering” is tightening.
What To Make Of Market Leadership
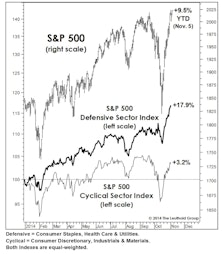
The renewed embrace of risk hasn’t extended to the sector level. After resisting decline in late September through mid-October, defensive sectors have matched the rebound in Cyclicals, almost point for point.
Market Internals—Breadth Weakness Troubling But Not Dire
Remember that peaks in market breadth tend to lead peaks in the S&P 500 by at least a few months.
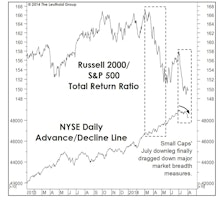
Small Cap Weakness Is Not A Market Death Knell

With Small Cap stocks falling to an 11-month RS low while the DJIA hits a new price high, many technicians point to this divergence as evidence the dangerous "distribution" period is underway. We're not so sure.
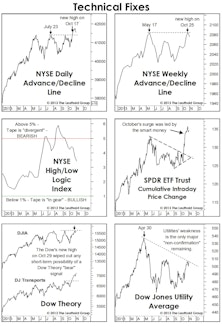
Stock Market Observations

DJIA eclipsed its year-end closing high; Dow Transports still strong; NYSE A/D Line hits all-time high.
Bulling Through The History Books
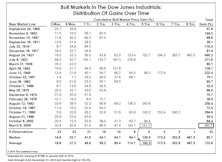
The Dow Jones Industrials’ bull market gain of +150% is well ahead of the long-term median (+86%) and average (+134%), and places the 2009-to-date move as the sixth-best all time.
Too Early For The Top?
January’s new breadth highs suggest new bull market price highs are likely some time in the next several months… but they can’t rule out a painful February.
Little To Complain About
From a pure price action perspective, it’s difficult to find cracks in the bull market’s edifice.
Is The Glass “Half Full”?
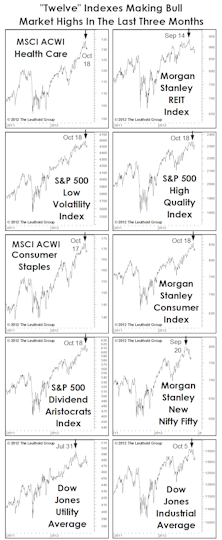
A “dozen” major market measures have moved to new bull market highs in the last three months. But many of these have been the groups that do best when “risk” is “off,” and may be a reason “Ain’t Nobody Happy,” even in an up year.
Major Trend Index (MTI) Goes Negative: Get Defensive

Major Trend Index fell to Negative at beginning of August. Assumption is that we are now in the beginning of a cyclical bear market that may produce a 20%-25% loss within the next six months or so.
Yet Another Breadth Blastoff
Another breadth blastoff gives us reasons for optimism that our bullish predictions for the end of the year will hold.
A Thinning Of The Ranks

Market breadth has weakened considerably, which has historically been a big negative for stocks. However, the lead time between peaks in market breadth and eventual bull market peaks are long and variable.
Advance/Decline Line & Price Line Divergences Offer Guidance

Using Breadth Dynamics to assess strength of small cap stocks versus large cap stocks within various broad market sectors: Health Care, Materials, Consumer Discretionary, and Energy.
Narrowing Of Breadth Among Small Caps

Leuthold Group specialized Advance/Decline Lines indicate fading breadth among Small Caps.
Stock Market Breadth Continues To Be Impressive

Market breadth using Advance/Decline Lines looks very bullish for stocks.
Perception for the Professional
March 2026 Issue

Featured Articles
Sector Navigator
March 2026 Issue
